Dashboard highlighted: Schedule
Back to blogs
Dashboard highlighted: Schedule


Dashboard highlighted: Schedule
Reading time: 2 minutes
EduViewz has been developed to give educational institutions insight into the data that is already available within educational institutions. By displaying this data clearly, visually and interactively, the requested data can be viewed, interpreted and analyzed in an accessible way. Because the data in EduViewz is always available, a comparison can always be made with historical data. Ultimately, it is even possible to make predictions for the future based on the historical data. EduViewz is available in Dutch, English and German.
EduViewz displays data in various dashboards. In the coming period we will introduce you to the different parts by means of articles.
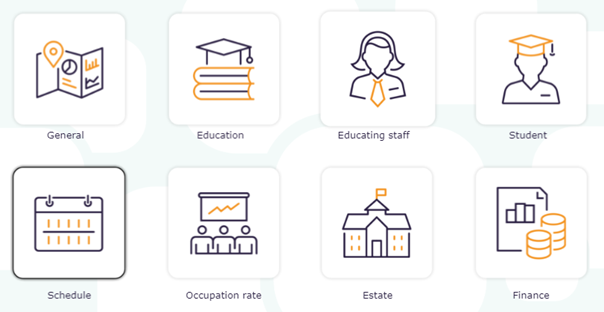
In this article, the Schedule dashboard is highlighted.
If students feel at home in an educational environment, they have a greater chance of successfully studying and obtaining the diploma. A good class schedule is helpful in this. The dashboard Schedule provides the end user with different dates regarding schedule changes. Changes in schedule are calculated by evaluating all activities in the scheduling system.
KPI
By adding Key Performance Indicators (KPIs) to a dashboard, the end user can immediately see whether the set objectives have been achieved or whether adjustments still need to be made in the process. The set goals and the number of KPIs can be determined by educational institutions themselves.
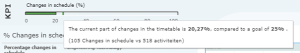
In the dashboard schedule, an educational institution can include a KPI with which the objective with regard to the maximum desired percentage of schedule changes is indicated.
![]()
In this overview, the end user immediately sees that the target (maximum 25% schedule changes) has not been achieved. The total number of activities and the schedule changes are also shown. The above example is the total overview of the entire educational institution. KPIs can also be displayed at faculty, department or educational level.
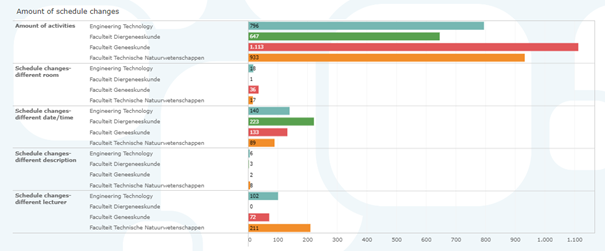
Schedule changes may vary in nature. For example, a room can change, the activity can take place at a different time or date, the description of the activity is adjusted or the activity is given by another lecturer. All these changes are also visible in the dashboard.
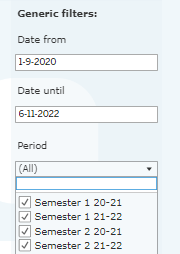
The end user can also set a number of general filters so that the data between a start and end date or per period can be called up.
Want to know more?
"*" indicates required fields
Related blog posts

EduViewz has been developed to give educational institutions insight into the data that is already available within educational institutions. By displaying this data clearly, visually and interactively, the requested data…

EduViewz: description dashboard “General” Reading time: 3 minutes EduViewz has been developed to give educational institutions insight into the data that is already available within educational institutions. By displaying this…
